If you’re a creator or business using TikTok to grow your brand or income, turning on analytics is one of the smartest things you can do.
TikTok Analytics gives you real data about your content performance, audience, and engagement trends. Whether you’re trying to land brand deals, go viral, or grow your following, analytics can help you make smarter, more strategic decisions.
In this guide, we’ll walk you through exactly how to turn on analytics on TikTok, on both mobile and desktop, plus how to use the insights to improve your content strategy.
Table of Contents
Key Takeaways
- Switching to a TikTok Creator or Business account is required to access analytics.
- Key metrics like views, watch time, engagement, and follower growth help refine your content strategy.
- Use analytics insights to test, optimize, and pitch your TikTok presence for brand deals.
What is TikTok Analytics?

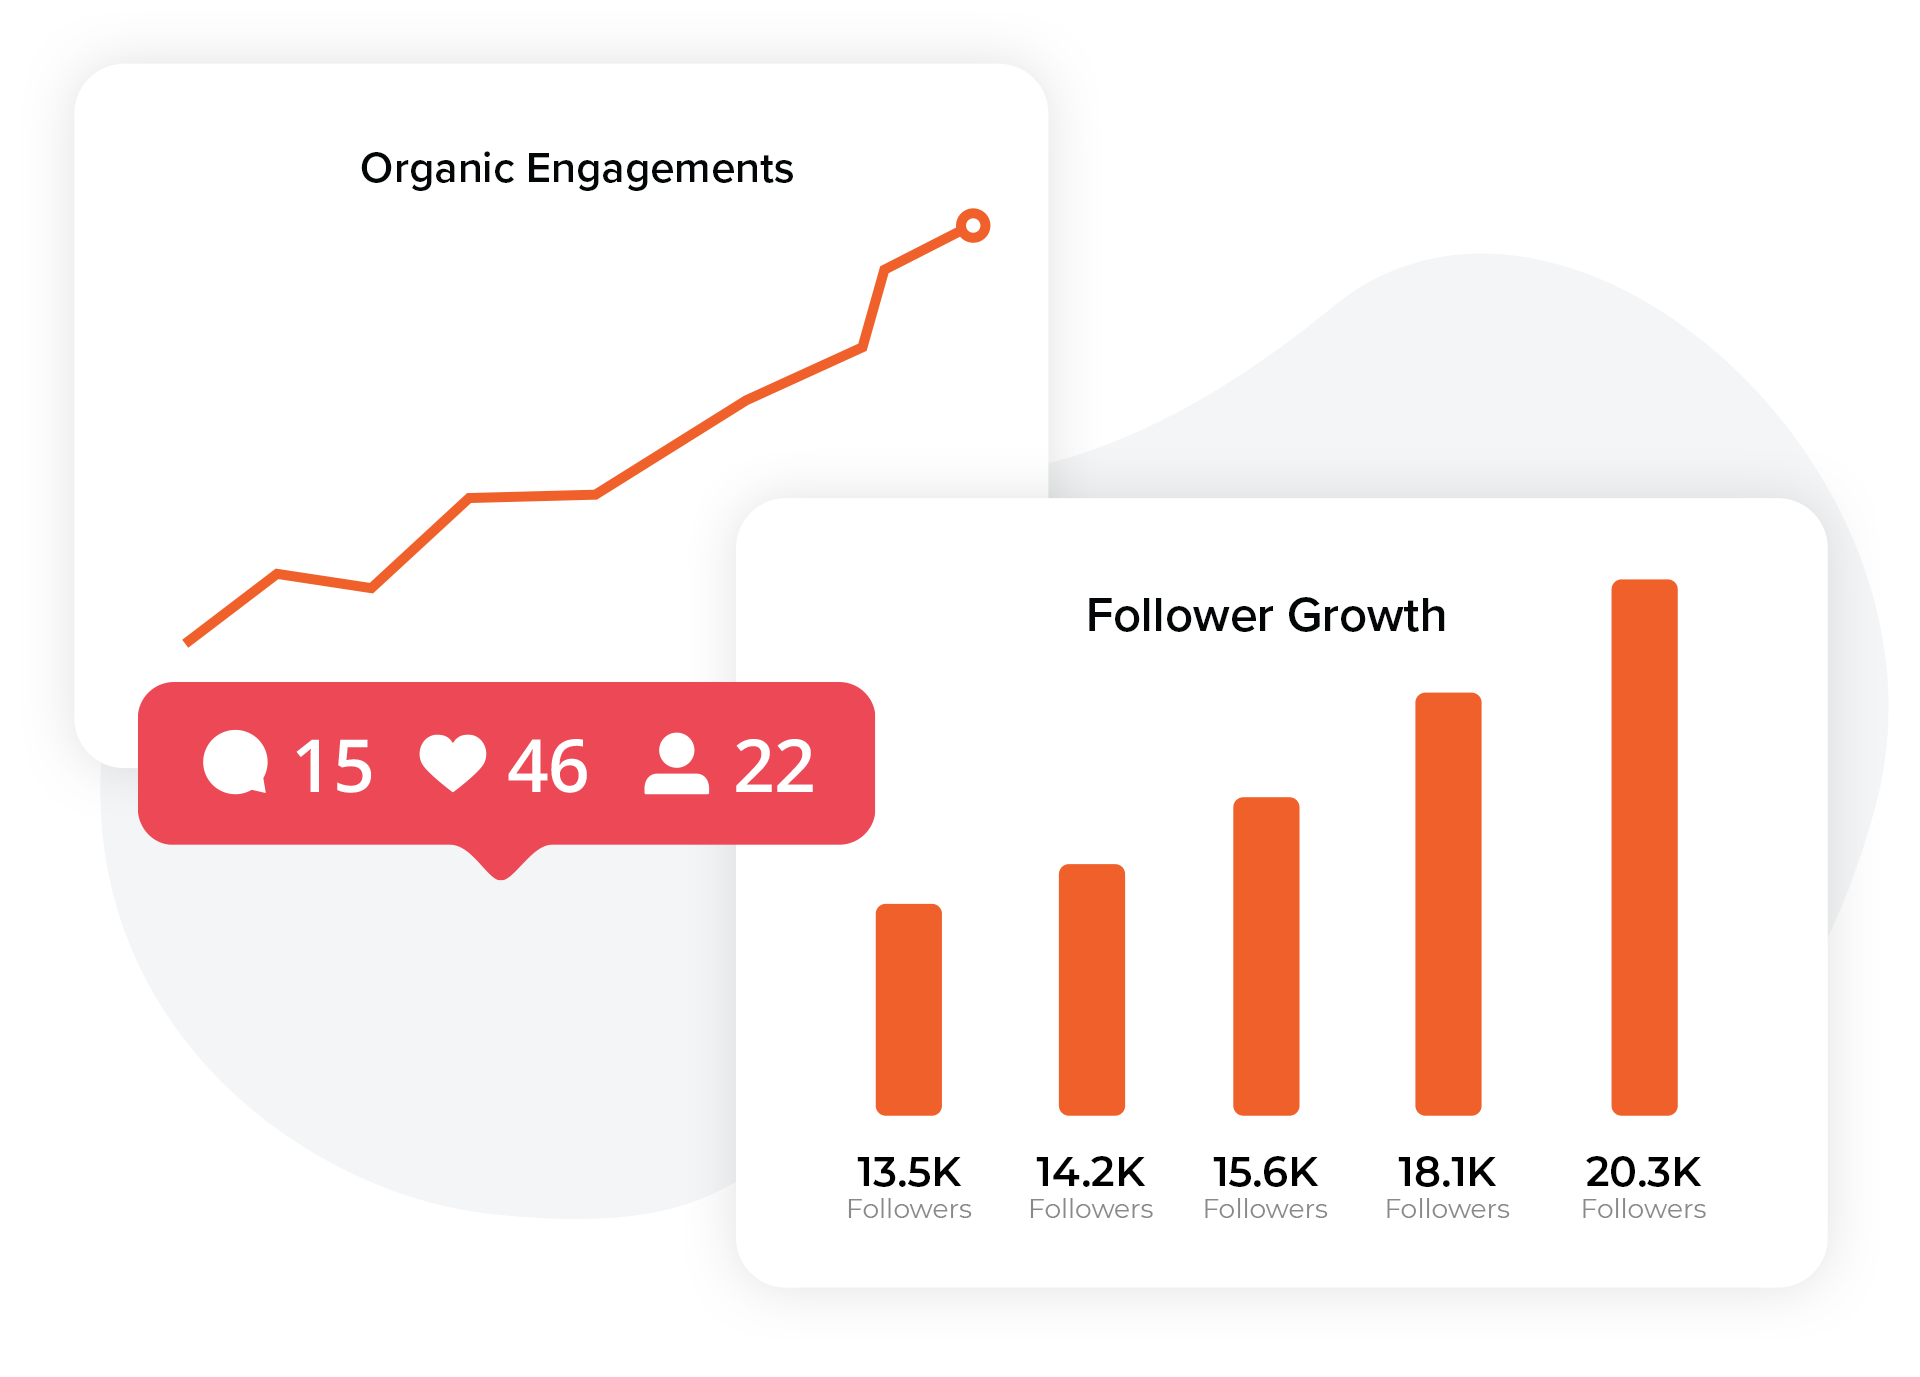
TikTok Analytics is a free tool built into TikTok that helps creators and businesses track how their content is performing. Once it’s turned on, you get access to a dashboard that shows key data like:
- Video views
- Follower growth
- Engagement rates (likes, comments, shares)
- Audience demographics
- Traffic sources
- Popular content performance
With analytics, you can spot what’s working and what’s not, identify peak posting times, and better understand your followers.
For example, if you notice your tutorial videos get more saves and shares than trend-based content, that’s a sign to create more how-tos.
Who Can View TikTok Analytics?
Only users with a Business Account or Creator Account can access TikTok Analytics. If you’re using a standard personal account, you’ll need to switch.
Here’s how to do that:
- Go to your TikTok profile.
- Tap the three-line menu in the top right.
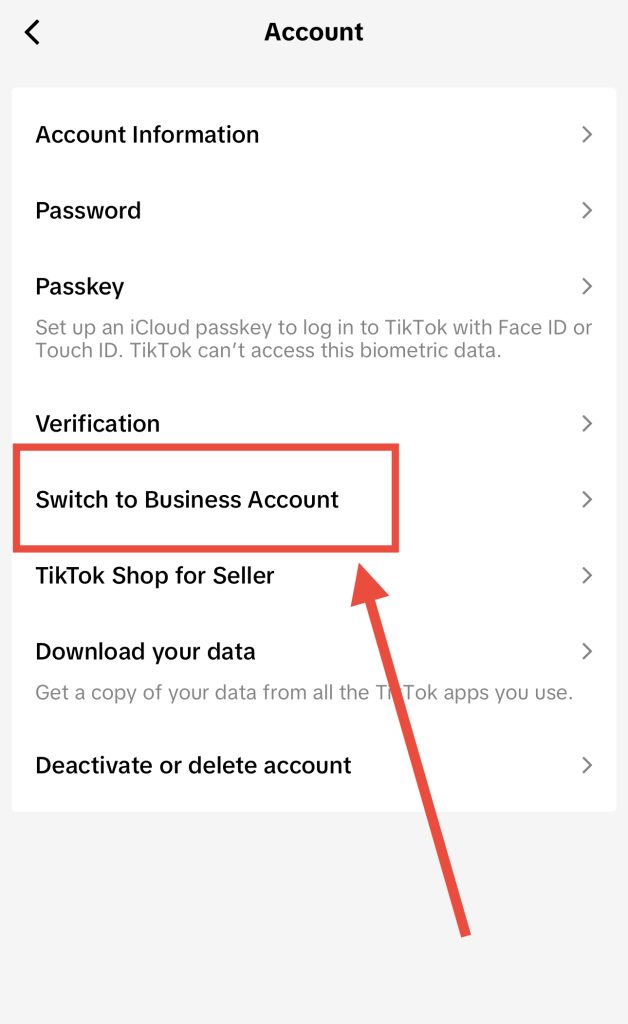
- Go to Settings and Privacy > Account > Switch to Business Account or Switch to Creator Account.
- Choose your category (e.g., Artist, Personal Blog, Education).
Once you’ve switched, TikTok starts tracking analytics for your content moving forward. It won’t retroactively give you data from before you made the switch.
How to Turn on Analytics on TikTok (Desktop)
If you prefer to manage your content on a larger screen, here’s how to turn on and access TikTok analytics from your desktop:
- Log in to TikTok.com using your browser.
- Hover over your profile icon at the top right and click Business Suite (or go to business.tiktok.com).
- Click Analytics from the left-side menu.
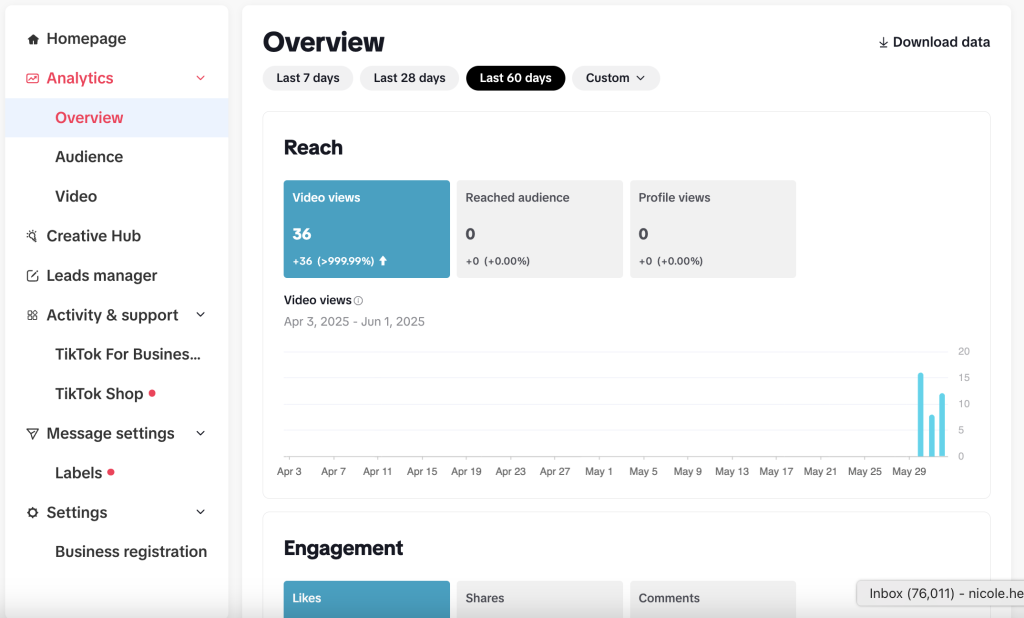
Your analytics dashboard includes four main tabs:
- Overview: General performance and trends
- Content: Performance data for individual videos
- Followers: Demographics and behavior of your audience
- LIVE: If you stream live, this shows your live engagement stats
Note: The desktop version is ideal for reviewing long-term performance and exporting reports for business use or brand pitches.
How to Enable Analytics on TikTok (Mobile)
Here’s how to check your TikTok analytics on mobile:
- Open the TikTok app and go to your profile.
- Tap the three-line menu in the top right.
- Go to Creator tools > Analytics.
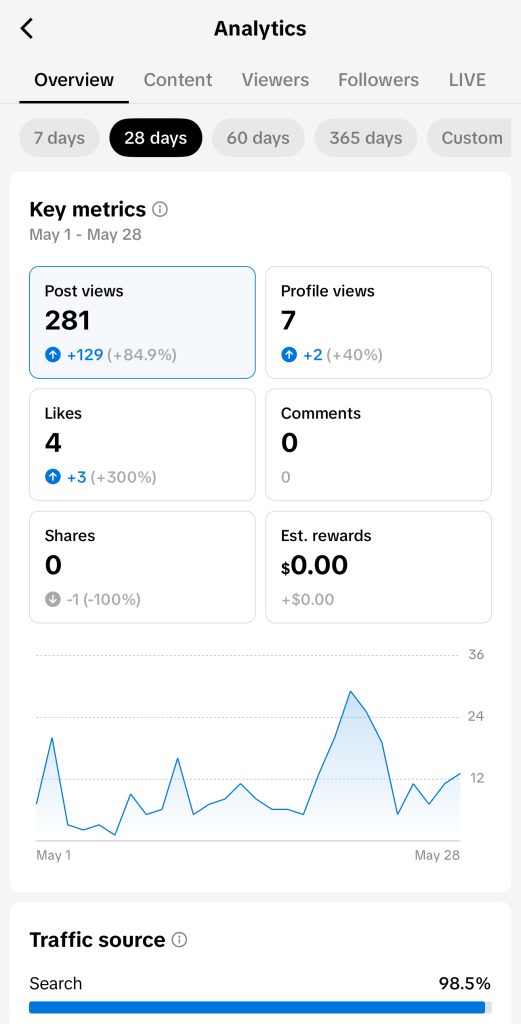
From there, you’ll see the same sections available on desktop:
- Overview: Video views, followers, profile views
- Content: Performance per video
- Followers: When they’re most active, gender, top territories
- LIVE: If you’ve hosted live sessions, this will show performance
Mobile analytics are great for quick checks on how a recent video is performing or if you want to understand why a post went viral.
4 TikTok Insights and Metrics to Monitor
Here are four key TikTok analytics to keep an eye on, and what they mean for your growth:
1. Video Views & Watch Time
This metric is your first clue to understanding how viewers interact with your content. High views can indicate strong discoverability and content appeal, but watch time reveals the true level of engagement.
For instance, a video with 10,000 views but only 3 seconds of average watch time means people are scrolling past fast. Compare different videos’ average watch times and adjust your opening hook or pacing to keep viewers engaged.
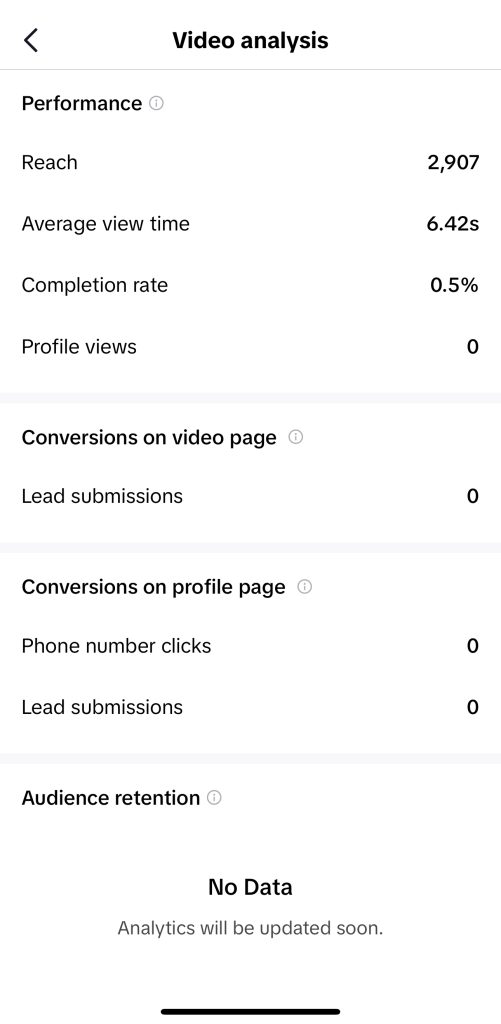
You can track this metric under the Video tab. Then, click on the video you want to analyze to see all the metrics.
Example: If you post a 30-second clip and the average watch time is 24 seconds, you’re doing well. But if it’s only 5 seconds, your intro may not be strong enough.
Actionable tip: Start your videos with a hook—ask a bold question or use text like “Wait for it…” or “Stitch incoming” to keep viewers watching.

2. Engagement Rate (Likes, Comments, Shares, Saves)
Engagement rate is a combined measure of how your audience responds to your content. It’s calculated by adding up likes, comments, shares, and saves, then dividing by total views.
For example, a high share count can indicate your content is resonating beyond your immediate followers, while saves mean viewers find your video valuable enough to return to later.
Experiment with different calls-to-action to boost these numbers, like asking viewers to share or tag a friend.
Example: If your video has 1,000 views but only 10 likes and no shares, it may need a clearer message or better call-to-action.
Actionable tip: End videos with a CTA like “Share if this helped you!” or “Save this for later” to boost those metrics.
3. Follower Growth
Watching your follower count over time shows you which videos or content series drive new audience growth.
Look for spikes in your follower chart and connect them to specific videos to understand what’s attracting people.
if a certain format or trend consistently drives new followers, integrate it more often into your content plan.
You can also buy TikTok followers to get your counts up while you work on manual growth, which is a great strategy with the right company.
Example: A sudden boost in followers might come from a trending audio you used or a viral comment. Replicate that format to maintain momentum.
Actionable tip: Use the pinned video feature to highlight your best-performing or most-follow-worthy content for new visitors.
4. Audience Demographics & Activity
This data helps you refine your content’s tone, topics, and even posting times. For example, if your main audience is teens in the US, you might create content that aligns with their interests, humor, and cultural references.
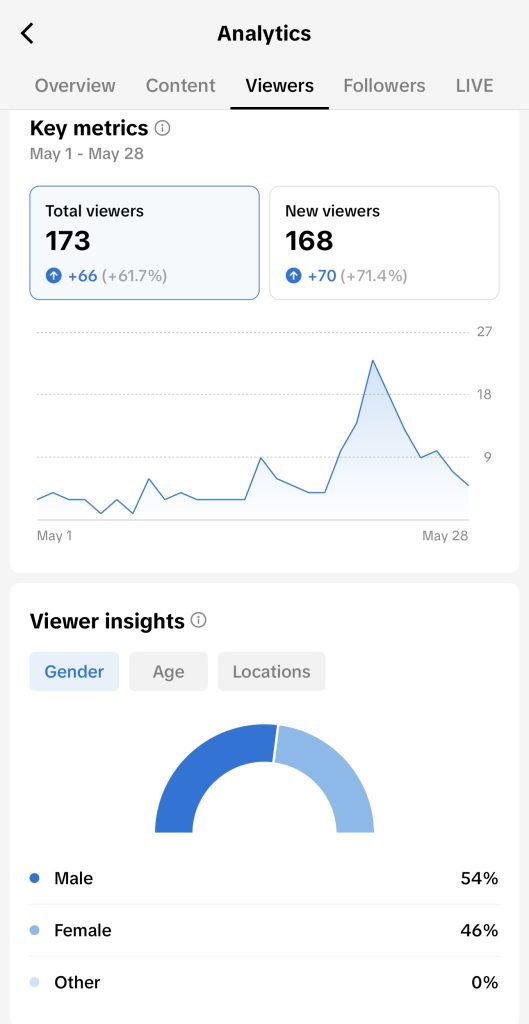
Look at when they’re online for best TikTok posting times, when engagement is highest. If your audience is global, consider posting multiple times a day to cater to different time zones.
Example: If your audience is mostly women aged 18-24 in the U.S. who are online around 7 PM EST, schedule content to drop just before then.
Actionable tip: Create content with your core audience in mind. If most followers are students, content that ties into school, exams, or productivity might land better.
How to Use Your TikTok Analytics in Your Content Strategy
Once you know how to read your analytics, the next step is turning insights into action. Here’s how to apply your data to build a stronger TikTok presence:
1. Double Down on What Works
Find your best-performing videos and analyze what made them successful. Was it the music, the type of hook, or the editing style?
Keep notes on these patterns and make them a staple in your content calendar. Recreate or remix these videos to keep your audience engaged while building your brand’s identity. Consider A/B testing to confirm your analysis.
Actionable tip: Use analytics to regularly identify your highest-engagement posts. Then recreate or remix them with slight variations, such as new captions or a different hook.
2. Fix What’s Failing
Low views or weak engagement are red flags, but also opportunities. Analyze poor-performing content to figure out what went wrong.
Was the video too long? Was the hook boring? Did the caption lack keywords?
Instead of writing off low-performing videos, use analytics to troubleshoot. Look at where viewers drop off in your video and improve that section next time.
Try different opening hooks, captions, or even visual styles to see what keeps people watching.
Actionable tip: Look for patterns in underperforming posts, then tweak elements like the format, music choice, or caption style.
3. A/B Test Content Types
Use analytics to test different versions of similar content. Try changing just one variable, like using a trending sound in one version and original audio in another, and see which performs better.
Then, you can try different video formats—like challenges, tutorials, or behind-the-scenes—and see which generates the most engagement.
Compare metrics across different formats and replicate the ones that consistently get the most positive reactions.
Actionable tip: Run small-scale tests weekly. This builds data over time and lets you optimize gradually without guessing.
4. Schedule Posts Based on Follower Activity
Don’t post when your audience is asleep. Use the Followers tab to identify peak times and days when your followers are most active.
Use your analytics to determine when that is, and post accordingly. This strategy maximizes your reach and boosts engagement, helping you build momentum on the platform.

If your analytics show that your followers are online at 9 AM and 8 PM, experiment with those times and track how your posts perform.
Action tip: Schedule your videos around 30 minutes before the peak window to give them a chance to build traction and engagement right away.
5. Create Content Series Based on Insights
If one tip video performs well, consider making it part of a series. A good format can become your content backbone.
If you find a certain content series or theme consistently performs well, double down and expand on it.
This helps establish your niche and builds a loyal audience. Use similar hashtags, branding, and even catchphrases to make it recognizable.
Actionable tip: Turn your top-performing video into a recurring format with a consistent title, tone, and structure—like “Monday Marketing Tips” or “Quick Fix Fridays.”
6. Pitch Yourself with Data
If you’re working with brands, your analytics are your proof of value. Screenshots or exported reports of your engagement and growth can help land you deals.
Use your analytics to back up your claims when pitching to brands. Highlight key metrics like engagement rates, average watch time, and audience demographics.
This data-driven approach can help you negotiate better deals and position yourself as a serious content creator or business. You’re also more likely to get TikTok collabs or brand partnerships.
Actionable tip: Highlight metrics like average engagement rate, follower growth, and top-performing content when pitching to brands.
FAQs
Still have some questions? We ahve a quick FAQ before you get over to your TikTok metrics!
How do I turn on the analytics feature on TikTok?
You don’t need to “turn on” analytics separately. Just switch to a Creator or Business account. Once you do, TikTok starts tracking your analytics automatically, and you can access them through the Creator Tools section on mobile or the Business Suite on desktop.
Why do I not have analytics on TikTok?
If you can’t find analytics, it’s likely because you’re using a personal account. You must switch to a Creator or Business account. Also, keep in mind that TikTok only starts tracking data from the moment you switch, so if you’ve just changed account types, give it time.
Does everyone have TikTok analytics?
No, only users with a Creator Account or Business Account have access to analytics. Personal accounts do not have this feature. Additionally, if you’re new to TikTok or don’t have any videos posted yet, your analytics dashboard may appear empty.
How to get TikTok Story analytics?
TikTok Stories have their own set of metrics, including views, shares, and replies. To see them:
- Go to your profile.
- Tap the Story icon (your profile photo with a blue ring, if available).
- Tap the three-dot menu on the story.
- Select View Analytics.
Keep in mind: Story analytics are time-sensitive and disappear when the story expires (usually after 24 hours).
Final Thoughts: How to Turn on Analytics on TikTok
Turning on TikTok analytics is one of the easiest and most valuable steps you can take as a creator or business.
Whether you’re looking to grow your following, improve your content, or land brand deals, your data will tell you what’s working and what’s not.
From checking video views to tracking your best posting times, analytics gives you a behind-the-scenes look at how your content performs.
So switch to a Creator or Business account, dive into your dashboard, and start building smarter, stronger content that connects and converts.
Remember: On TikTok, content is king, but data is the compass!
Now that you know how to turn on analytics on TikTok, make the most of it so your content can shine.
What metric are you most looking forward to analyzing? Let us know in the comments!